Two windows.
The same direction.
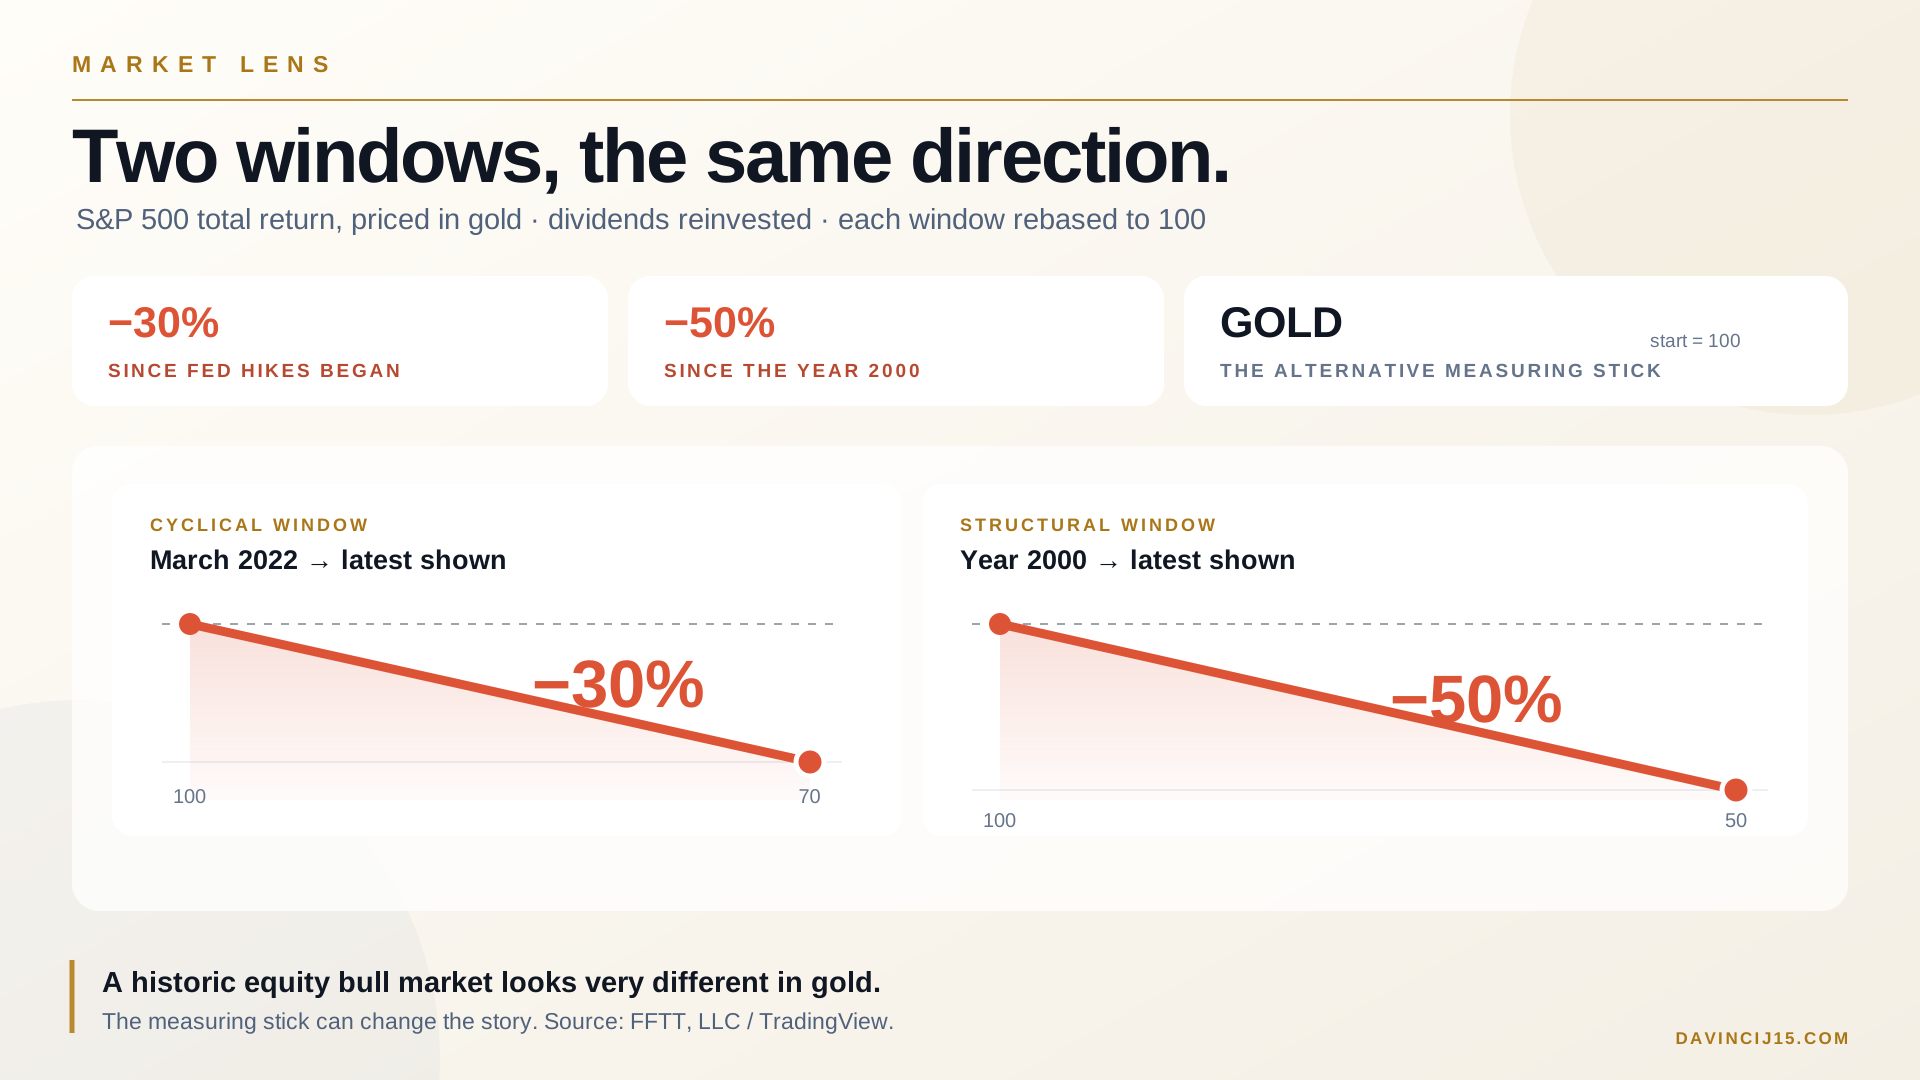
When the S&P 500 total return index is priced in gold, the referenced comparison shows a decline of 30% since March 2022 and 50% since 2000.
Each window rebased to 100 · dividends reinvested
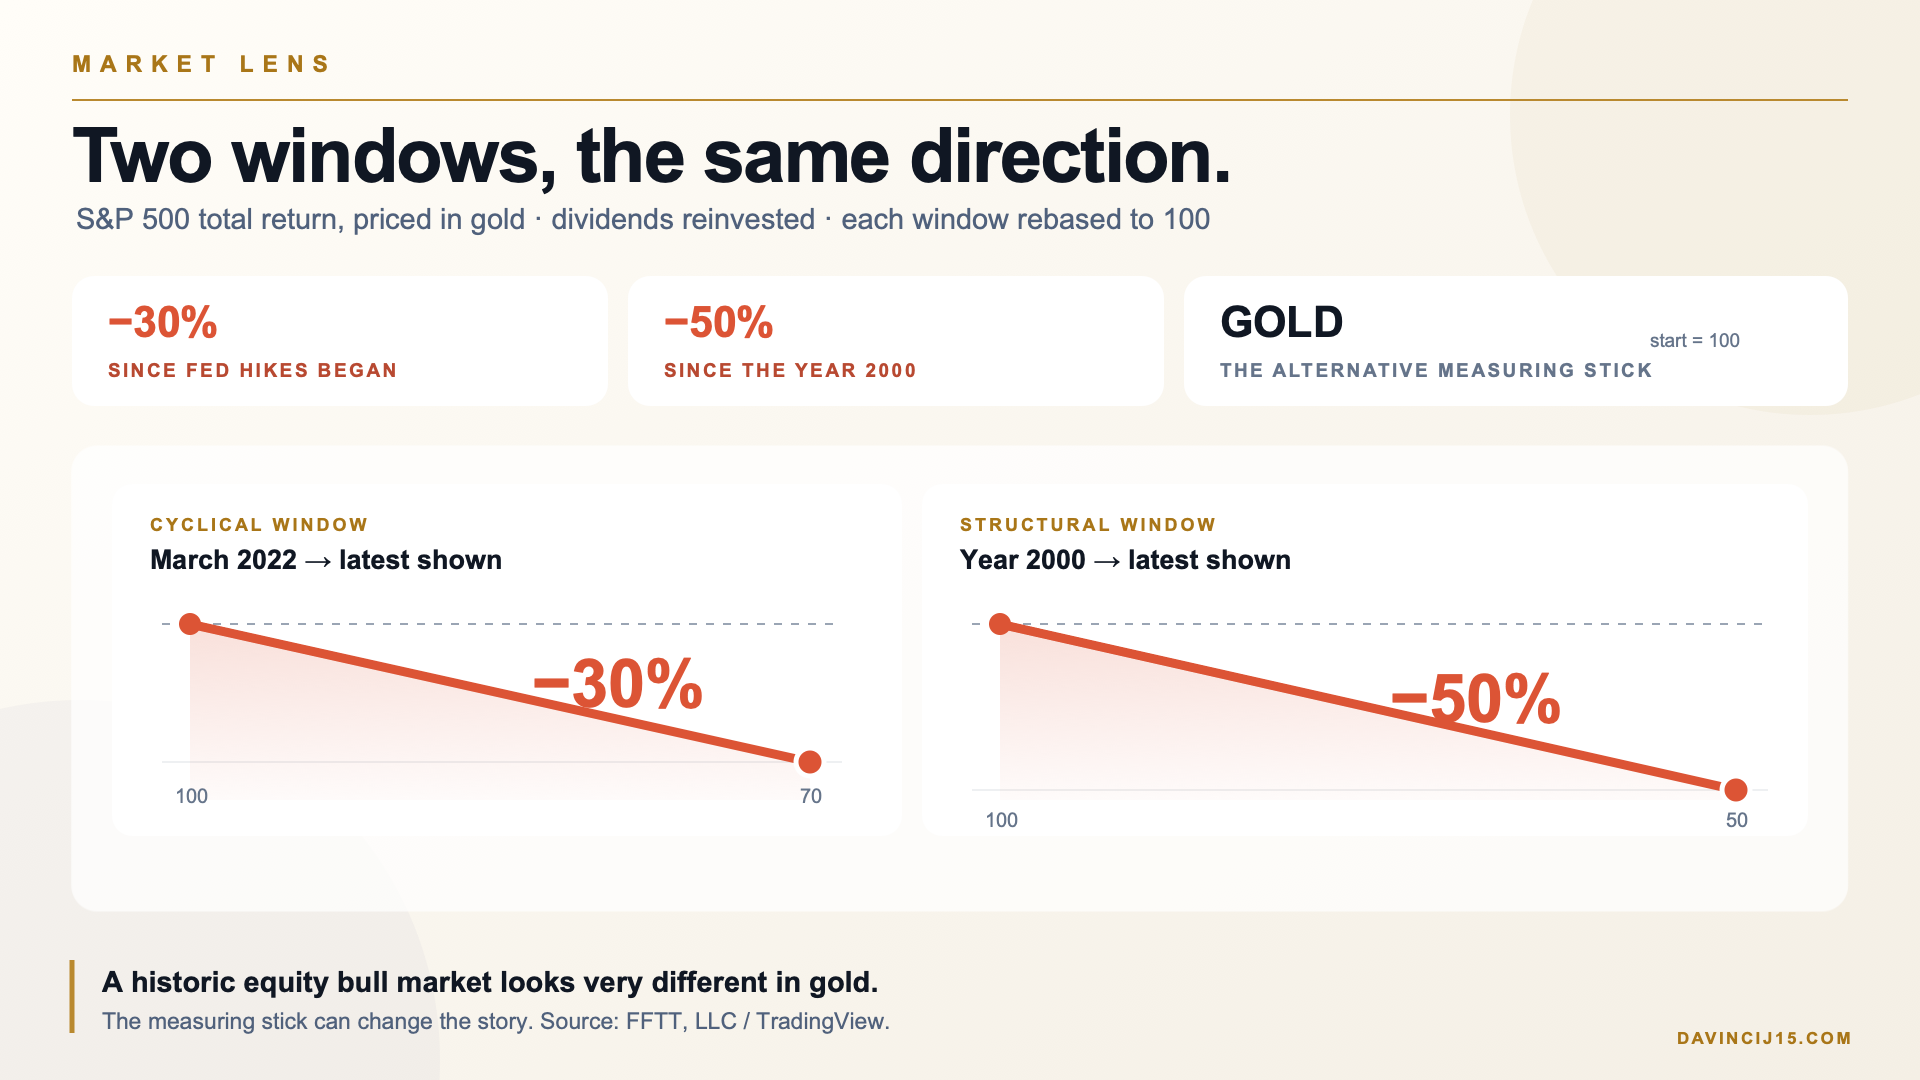
When the S&P 500 total return index is priced in gold, the referenced comparison shows a decline of 30% since March 2022 and 50% since 2000.
Dividends reinvested. Each window starts at 100. Source: FFTT, LLC / TradingView. This visual reproduces the headline start/end comparison from the referenced chart. Educational information, not financial advice.